
Free 13-week cash flow forecast template
Know your cash 13 weeks out, week by week.
The 13-week cash flow is the forecast your lender, your board and your CFO all ask for when things get tight. This template does the boring parts for you. You enter what you expect to come in and go out. It works out closing cash, draws or repays the credit line to hold your minimum buffer, and flags any week that dips below it. It comes in two versions. Weekly works from weekly totals. Weeks + Months adds a calendar-month report.
Free · Excel, 2 versions: Weekly and Weeks + Months
Highlights
The credit line handled for you
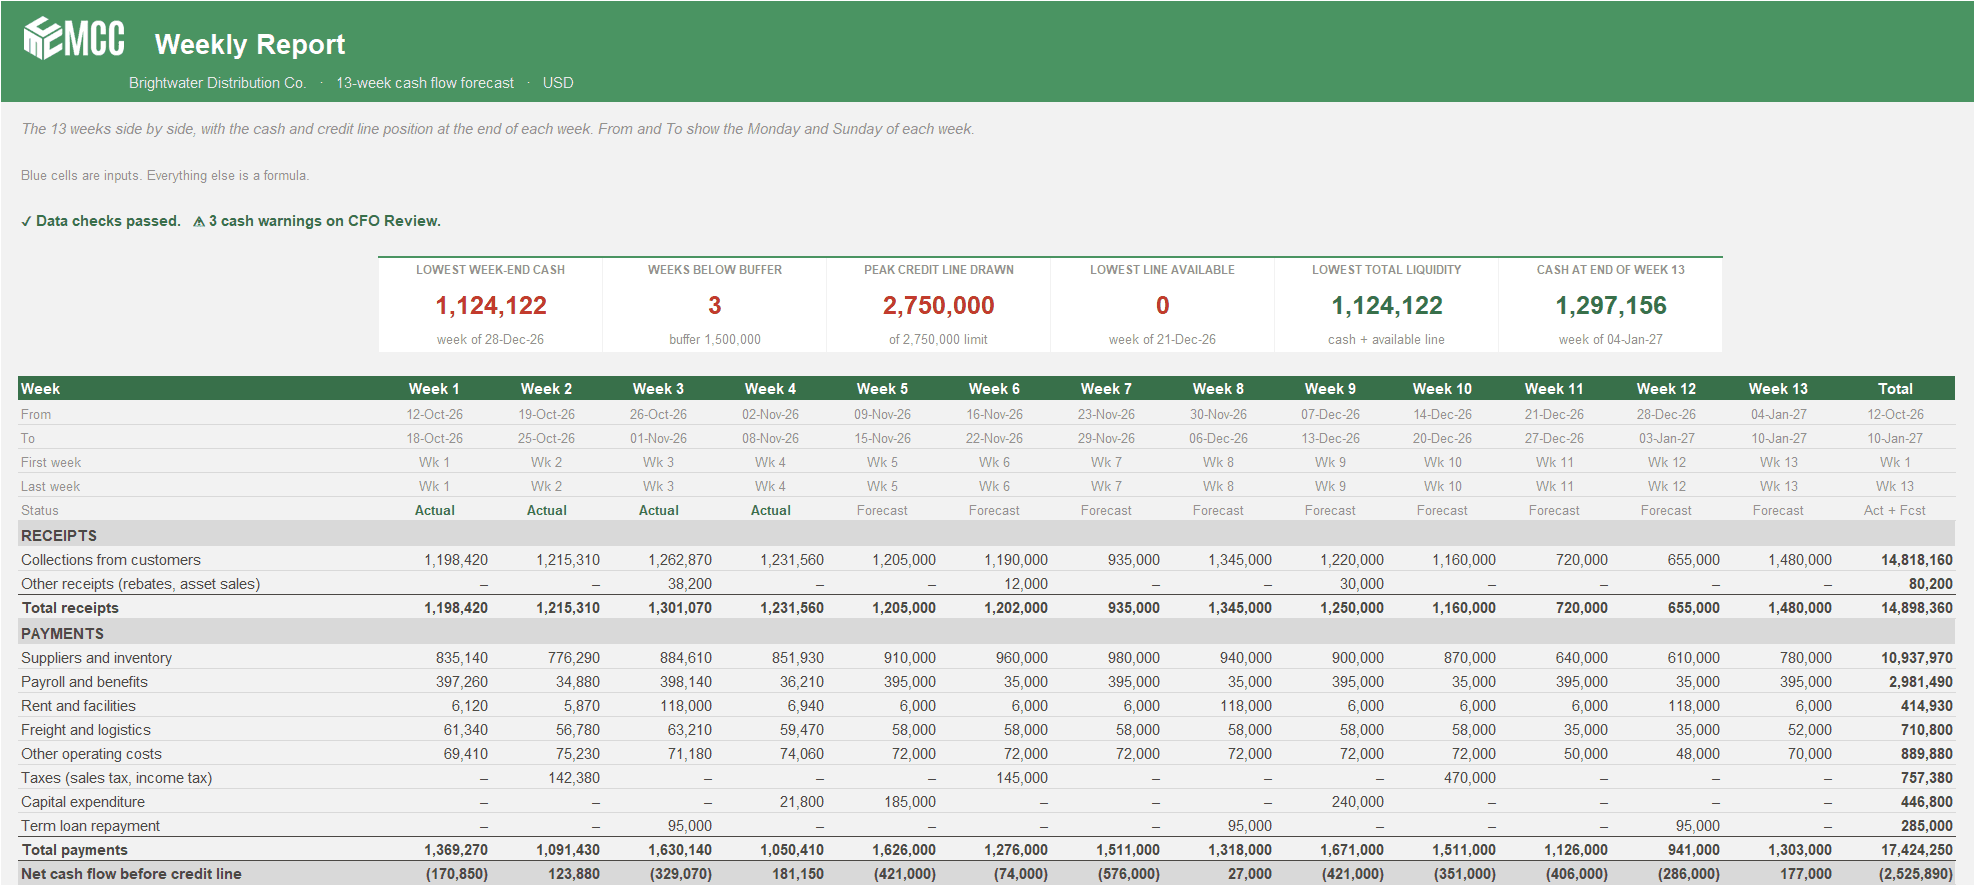
Closing cash every week, with the line drawn or repaid to hold your minimum buffer. Any week that dips below it is flagged.
Forecast checked against the bank
Each Monday, last week's actuals go in. Closed weeks switch to actual, and a bank check shows whether the statement and the model agree.
Reviewed before it goes out
Eight key figures and twelve checks (thirteen in the Weeks + Months version) on the CFO Review tab before the forecast goes to the bank or the board.
Why a weekly view of cash?
Most companies plan by month. Cash doesn't move by month. Payroll, rent, supplier runs and customer collections land in different weeks, so a month can close comfortably while the bank balance hits its low point in week two.
The 13-week forecast is built to catch that. It covers one quarter, week by week. Every Monday you add last week's actuals from the bank statement, closed weeks switch from forecast to actual, and the model checks that it still agrees with the bank. At the end of the quarter you set a new week 1.
Who it's for
- Finance teams who plan by month but get caught out by cash in a single week.
- Companies with a credit line and a minimum cash buffer to hold.
- CFOs and controllers who owe the lender or the board a 13-week view.
- Teams that report cash by month as well as by week, with a customer or supplier behind every number. That's the Weeks + Months version.
What's inside
The Weekly version has seven working tabs. Every tab reads from Setup, and everything that isn't a shaded input is a formula.
Setup
Company, week 1, opening cash, minimum cash buffer, credit line limit, opening draw and interest rate.
Forecast
Receipts and payments for each of the 13 weeks: collections, suppliers and inventory, payroll, rent, freight, operating costs, taxes, capex and loan repayments.
Actuals
What really moved last week, plus credit line draws, interest and the closing bank balance.
13-Week Cash
Opening to closing cash every week, headroom over the buffer, credit line drawn and available, and total liquidity. A bank check shows whether the statement and the model agree.
Weekly Report
The 13 weeks side by side, with tiles for the lowest week-end cash, weeks below the buffer, peak credit line use and cash at the end of week 13, plus a chart of cash against the buffer.
Variance
Actual against the original forecast for closed weeks, better or worse from a cash point of view, with a comment on each line.
CFO Review
Eight key figures and twelve checks before the forecast goes to the bank or the board. A cross means a data problem to fix. A warning means a cash position to act on. Sign-off at the bottom.
About Vena and MCC
Who built the template, and what changes when the same forecast runs in Vena.
Two versions. Pick the one that fits.
Both versions build the same 13-week view and the same CFO review. The difference is what you type in.
- Weekly
A fast weekly liquidity check.
Enter totals per week. The quickest way to get a 13-week view running.
Tabs
- About Vena and MCC
- Setup
- Forecast
- Actuals
- 13-Week Cash
- Weekly Report
- Variance
- CFO Review
- Weeks + Months
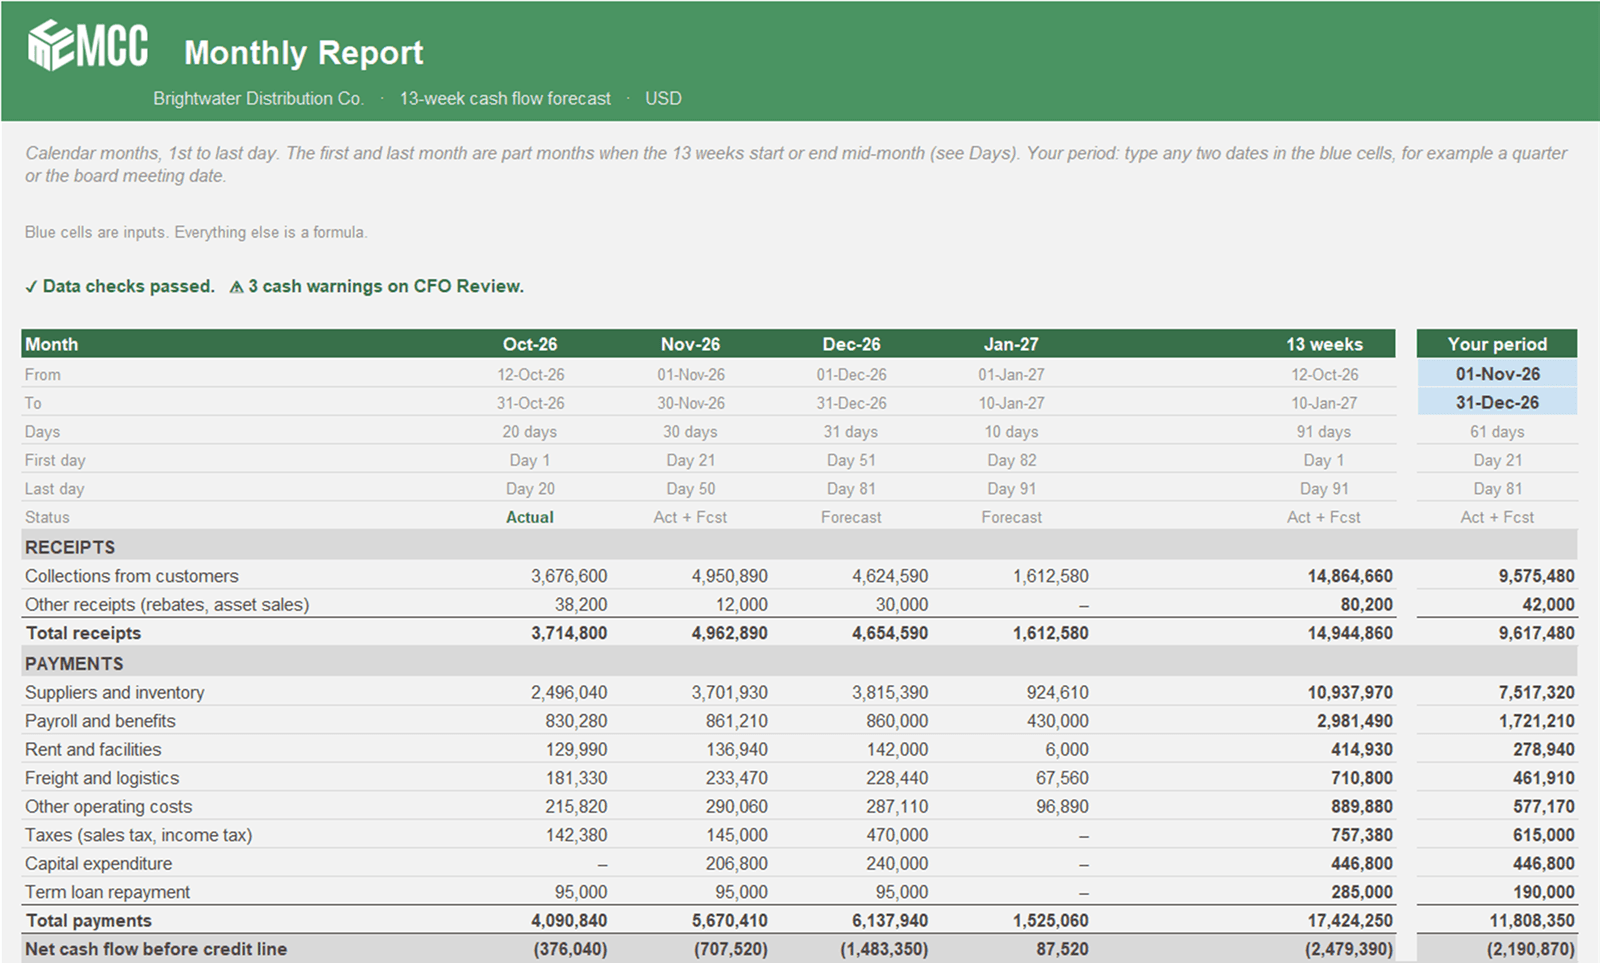
Weekly and monthly reports, with a name behind every number.
Enter each receipt and payment as a row, with the customer or supplier, a forecast date and amount, and later the actual. It builds cash day by day for 91 days, then reports by week, by calendar month and for any two dates you pick. It flags overdue receipts, late payers, possible duplicates and any customer above 25% of receipts.
Tabs
- About Vena and MCC
- Setup
- Transactions
- Daily Cash
- Weekly Report
- Monthly Report
- Variance
- CFO Review
How to use it
Step 1: Fill in Setup
Company, first Monday, opening cash, your minimum buffer and the credit line.
Step 2: Enter the forecast
Your 13 weeks of receipts and payments. Shaded cells are inputs, everything else is a formula.
Step 3: Close last week
Every Monday, enter last week's actuals from the bank and raise Weeks closed by 1 on Setup.
Step 4: Read the review
Check the Weekly Report and the CFO Review. Fix anything marked as a data problem, act on any cash warning.
Questions about the template
Is the template really free?
Yes. Leave your name and work email and both versions download right away. The file is yours to keep and change.
Do I need Vena to use it?
Not to start. The 13-week cash flow template runs in plain Excel, with no macros and no add-ins. Vena comes in when more people need to work in the same forecast.
Which version should I pick?
Weekly if you want a fast liquidity check from weekly totals. Weeks + Months if you also report cash by calendar month, or every number needs a customer or supplier behind it. Both cover the same 13 weeks and both end in a CFO Review with key figures, checks and a sign-off.
Is the sample data real?
No. Brightwater Distribution Co. and its numbers are made up, so you can see how the file works before you type in your own.
The company, customers and figures in this template are made-up sample data. MCC is an independent Vena partner.
Last updated
From a spreadsheet to a process you can trust
When more people need to work in it, MCC can set it up in Vena for you.
Talk to our team- 1
Use this template
Free, in plain Excel. Change the shaded inputs and the rest updates.
- 2
Have MCC set it up in Vena
Keep the Excel layout, and add one Vena data model, approvals and an audit trail. We build it and check that it ties.
More templates
- Planning
- Forecasting
- Cash
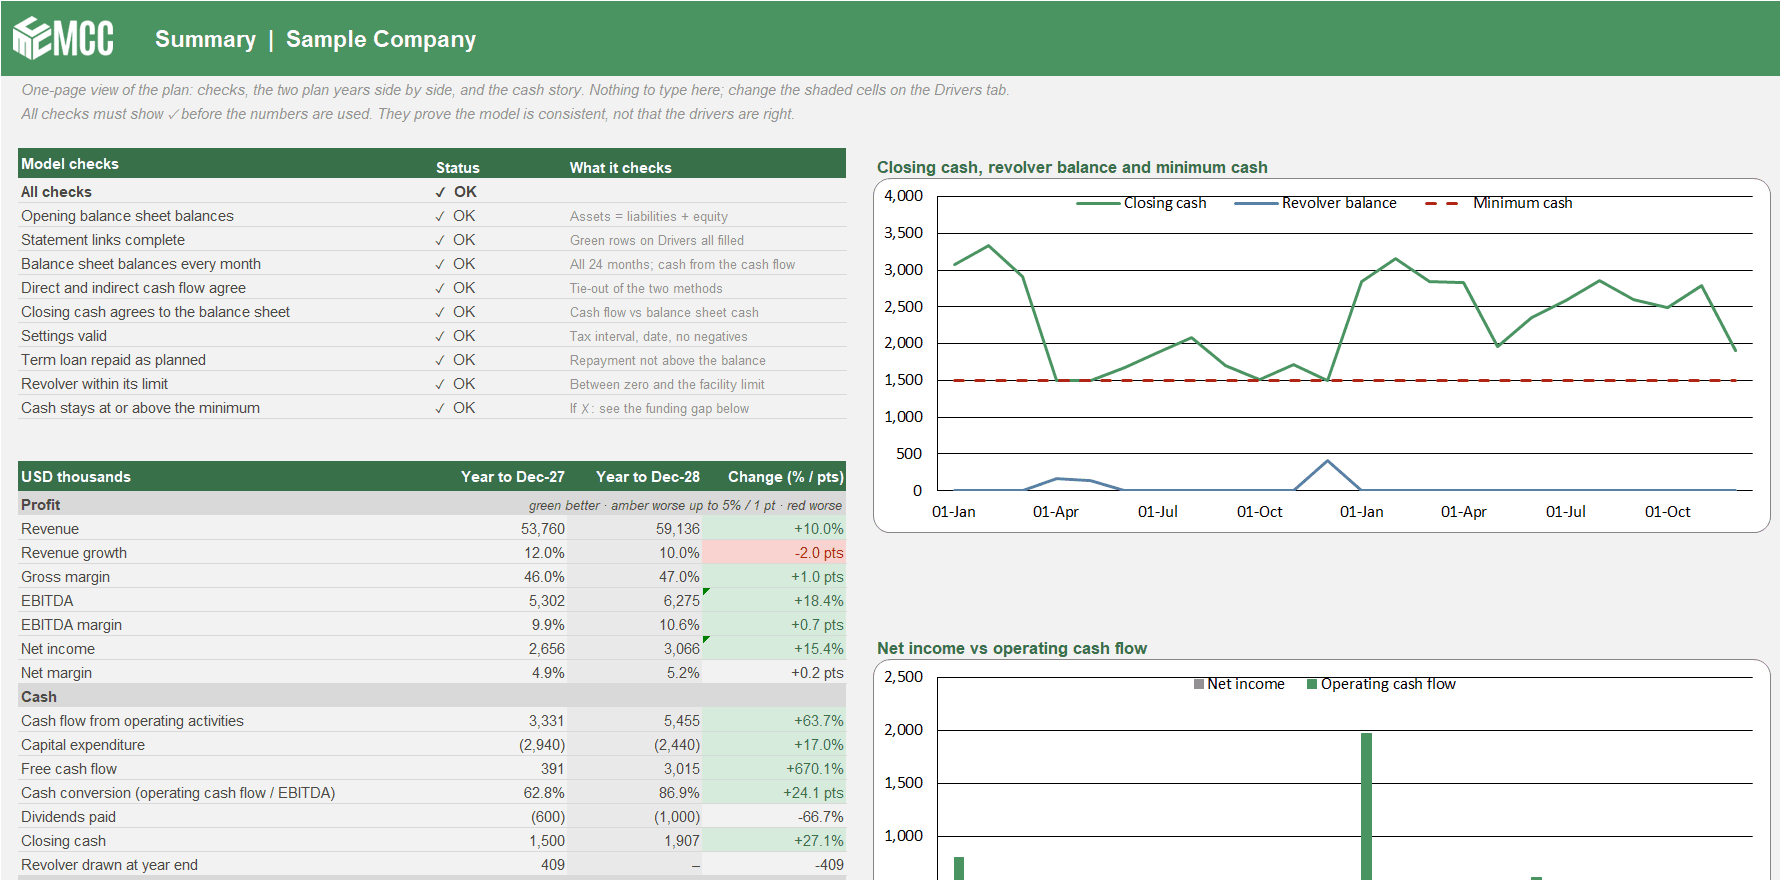
Three-Statement Driver Model
Your P&L, balance sheet and cash flow linked month by month for 24 months. Change a driver and profit, working capital, cash and the revolver all move together.
Free · ExcelDownload free
- Reporting
- Board
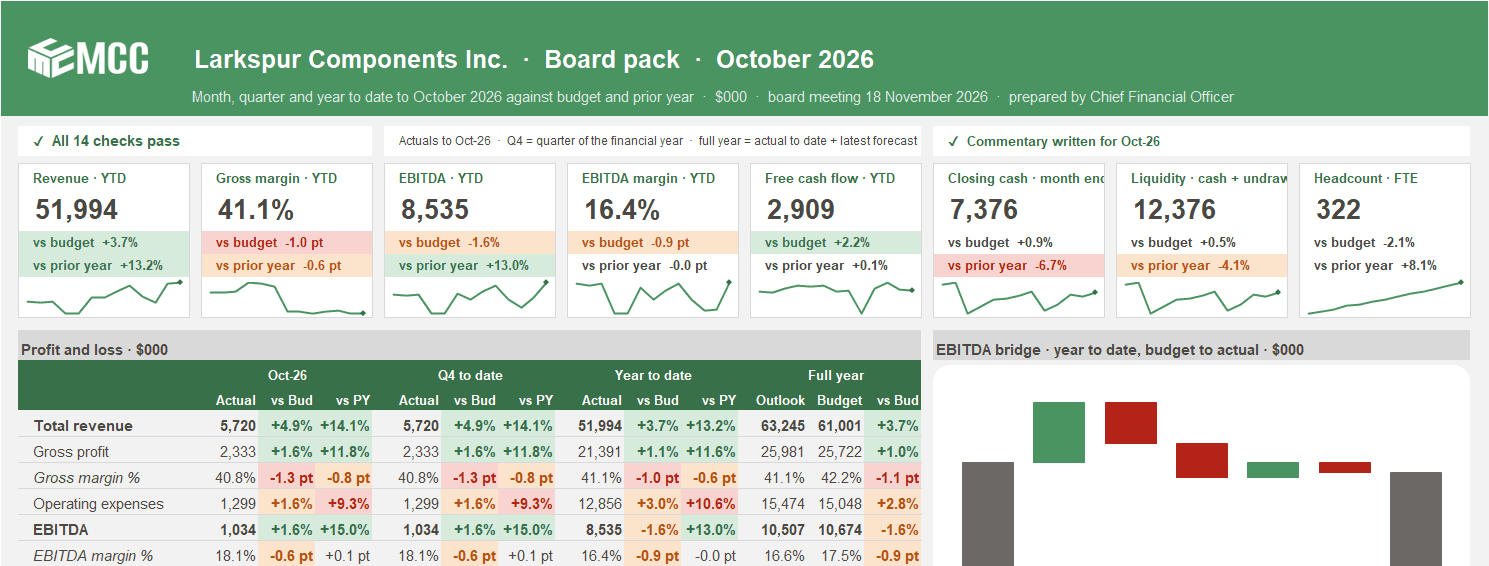
Board Pack on a Page
A one-page board report that rebuilds itself when you pick the month. KPI tiles, P&L, EBITDA bridge, cash and commentary, from one data tab.
Free · ExcelDownload free
- Planning
- Hospitality
Hotel Budget by Department
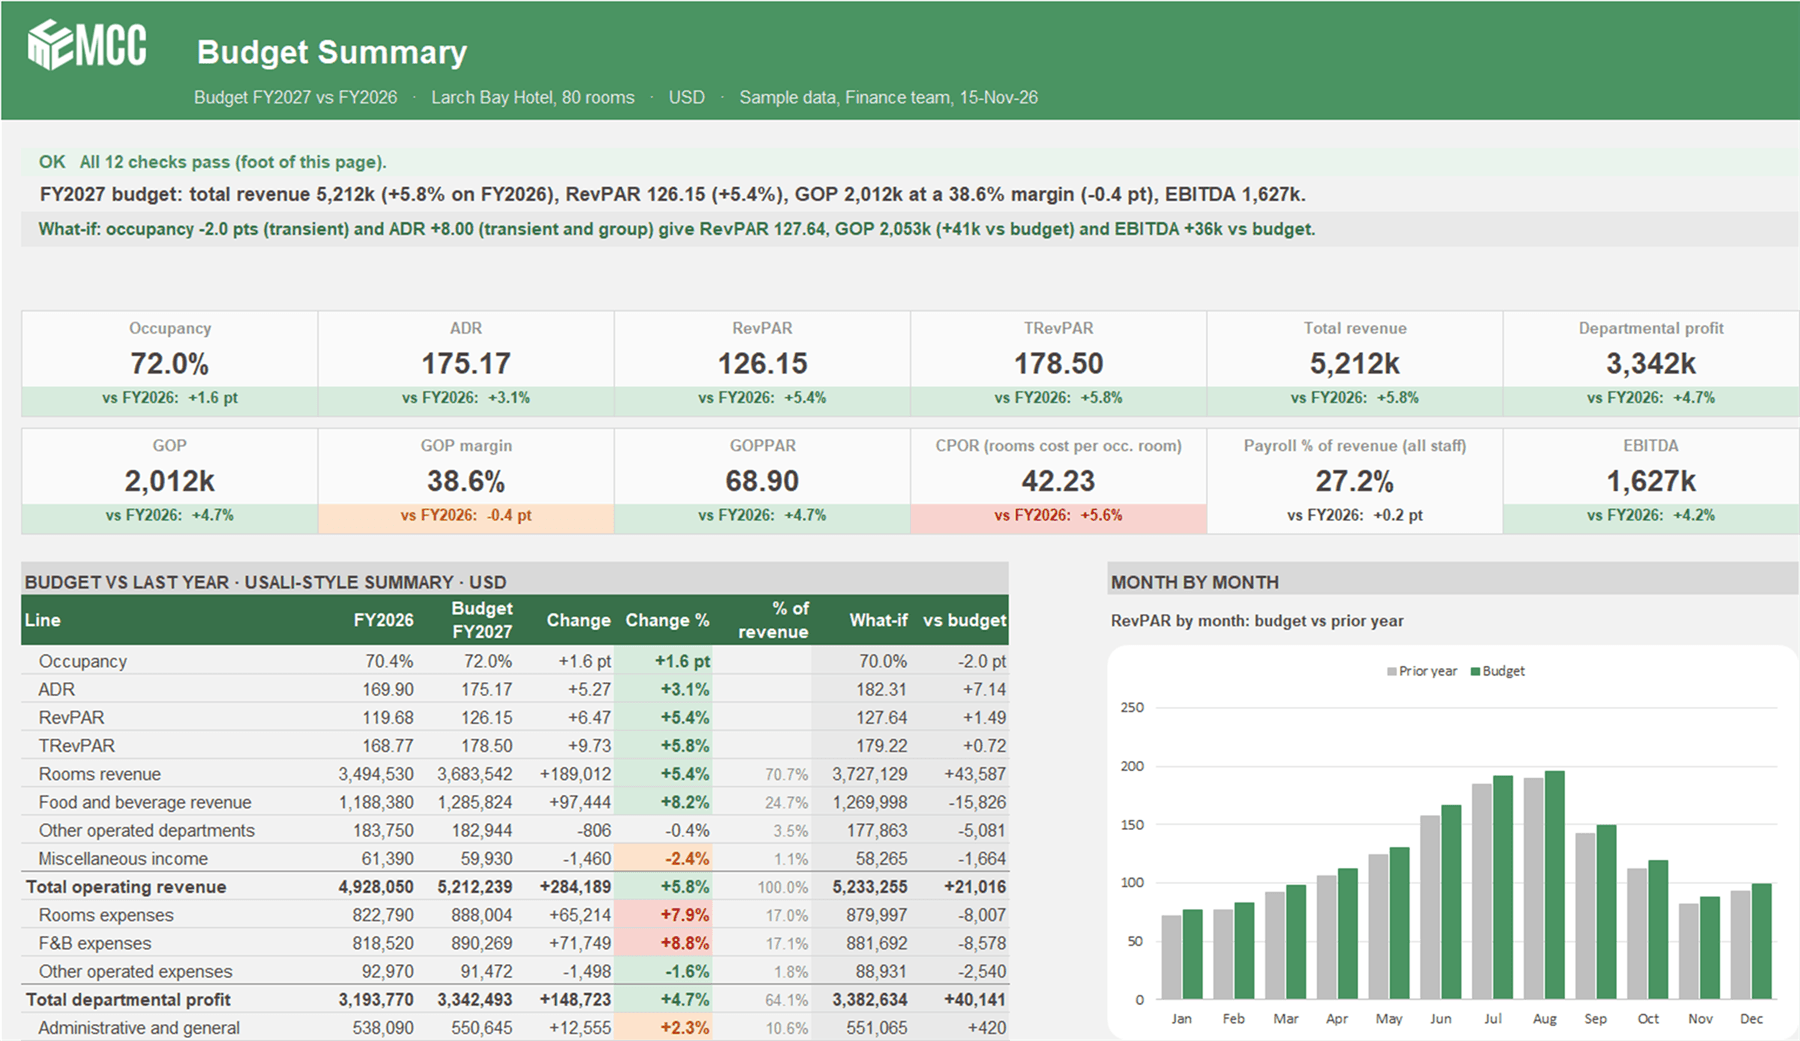
A driver-based annual hotel budget. Occupancy and ADR by segment, covers by outlet, a USALI-style departmental P&L to GOP and EBITDA, and a what-if in one step.
Free · ExcelDownload free
Got a problem a template doesn't cover?
Talk to our team about it. Not ready for a call? Watch the Finance Speedrun and see how we solve a real finance problem live every week.